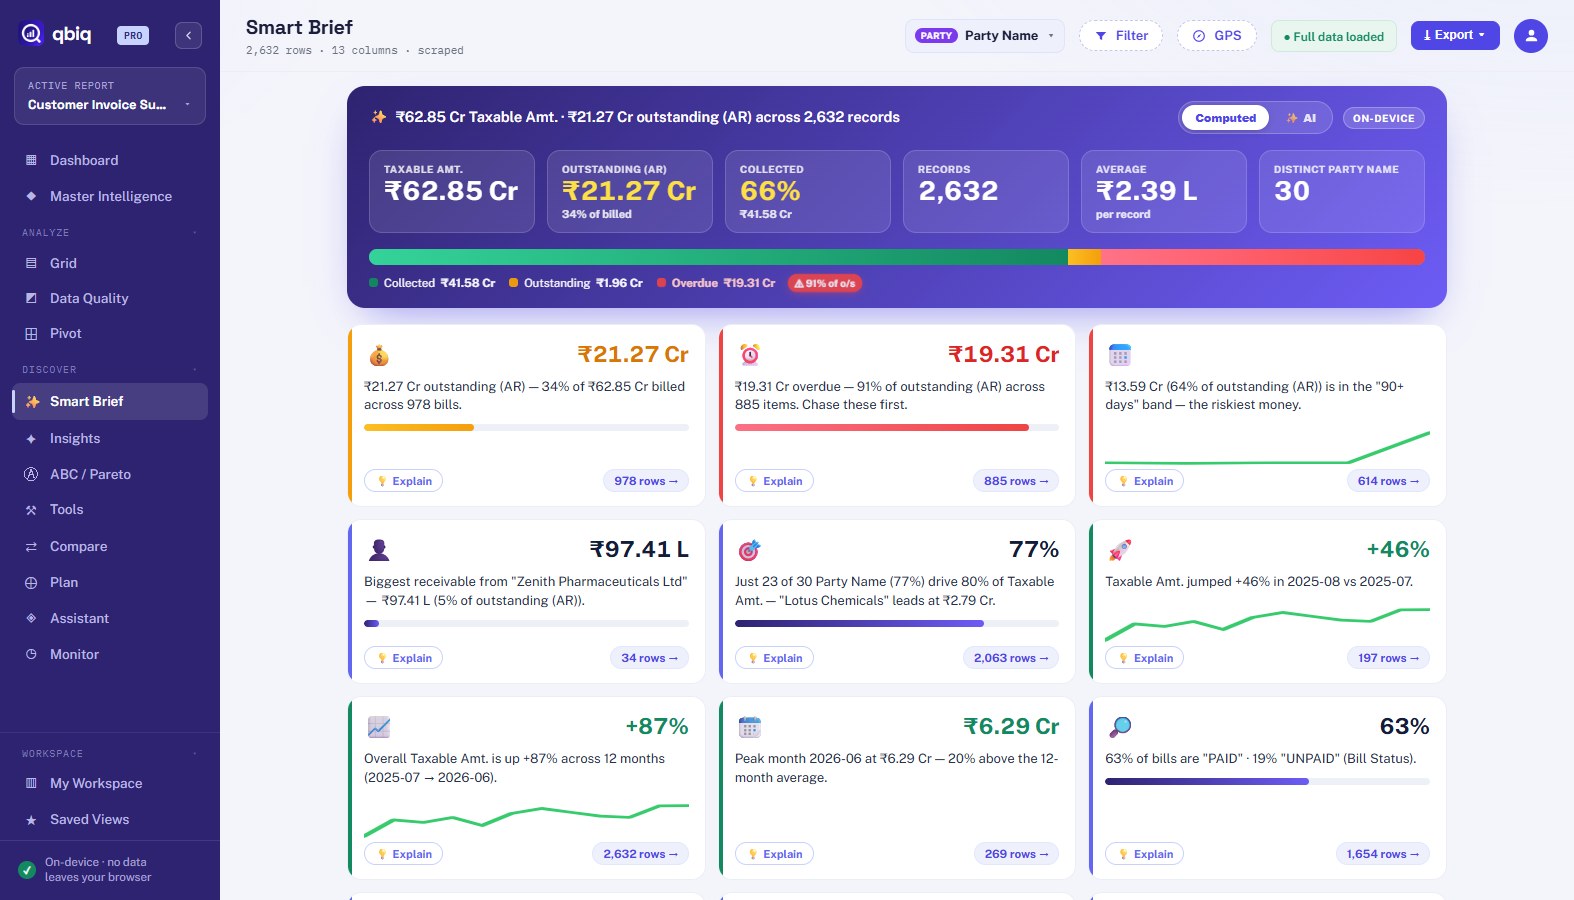
100% on-device analytics

Instant analytics on any ERP report.

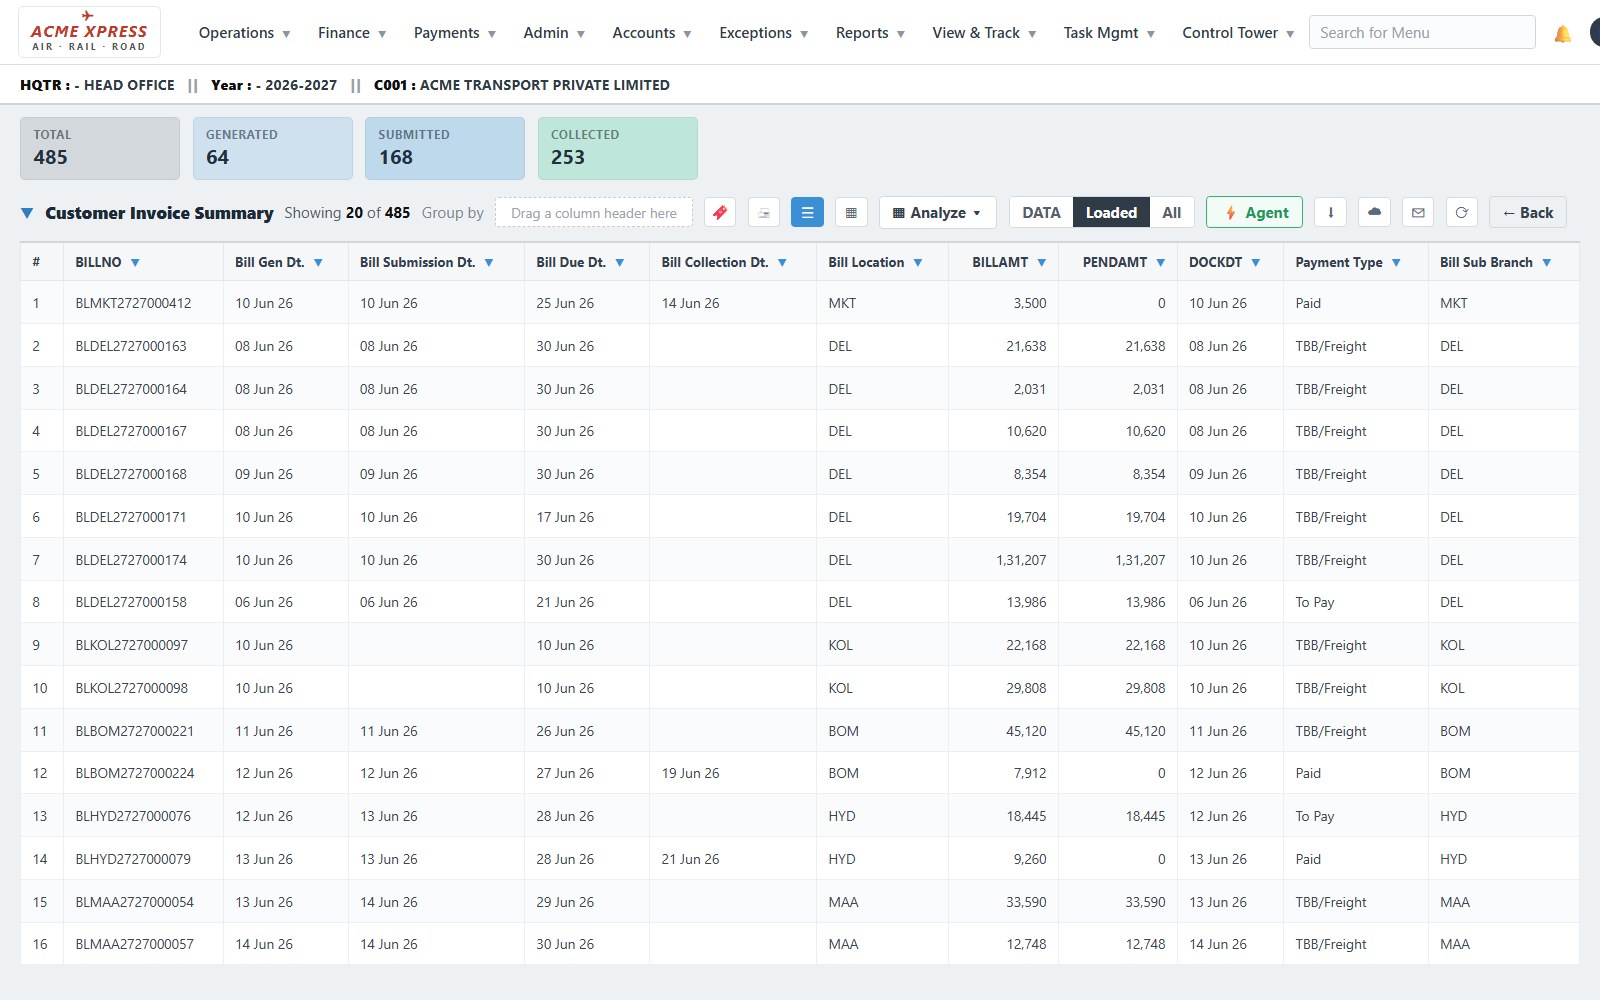
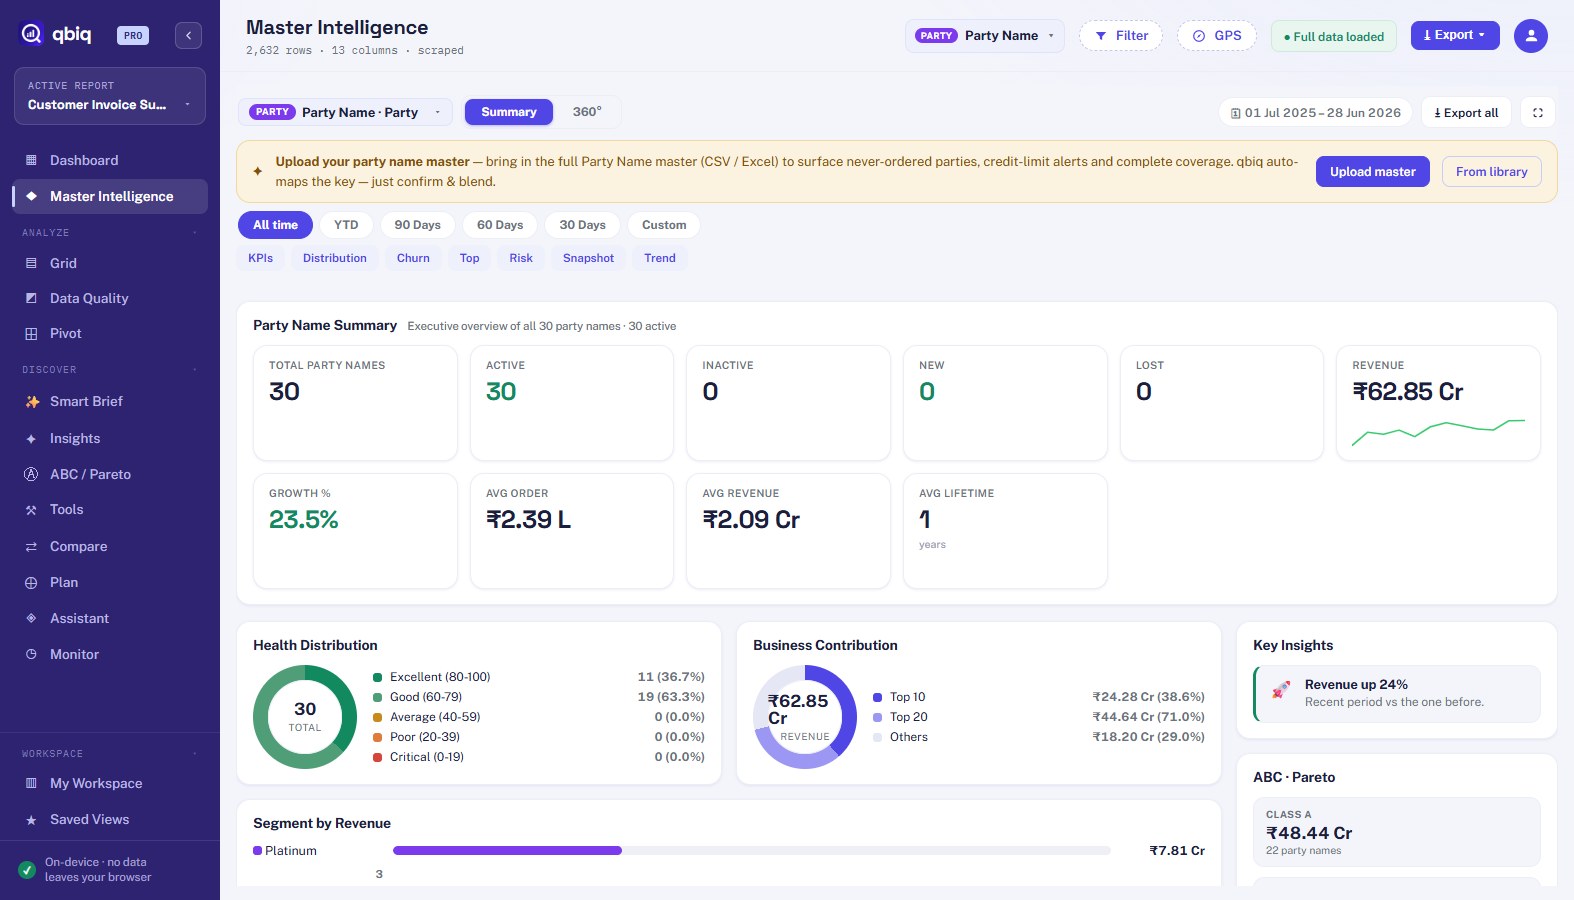
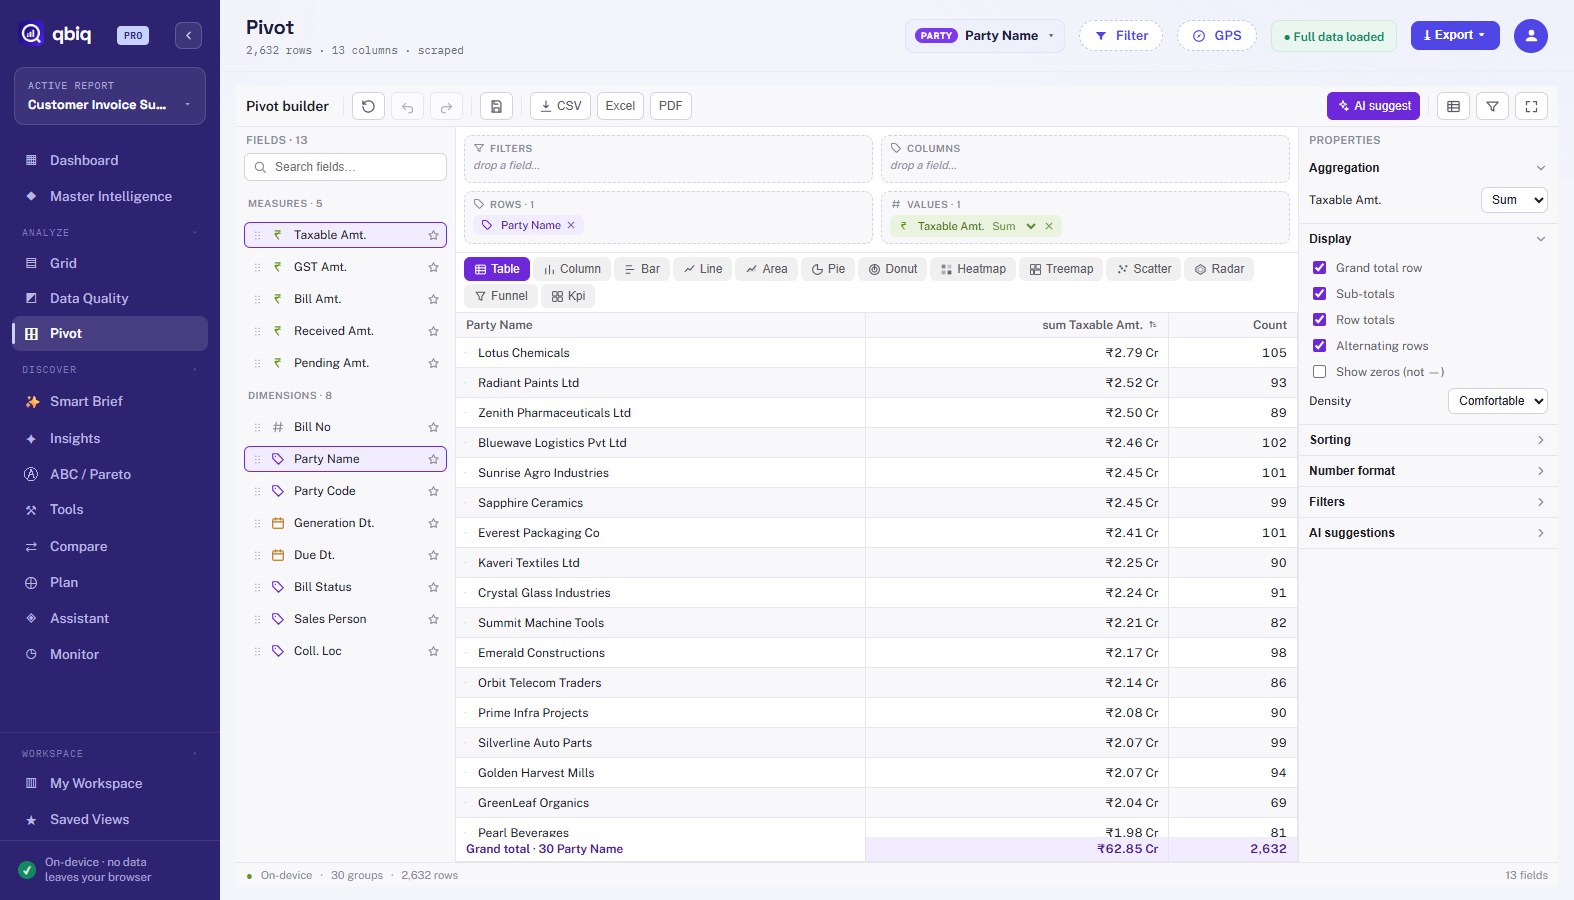
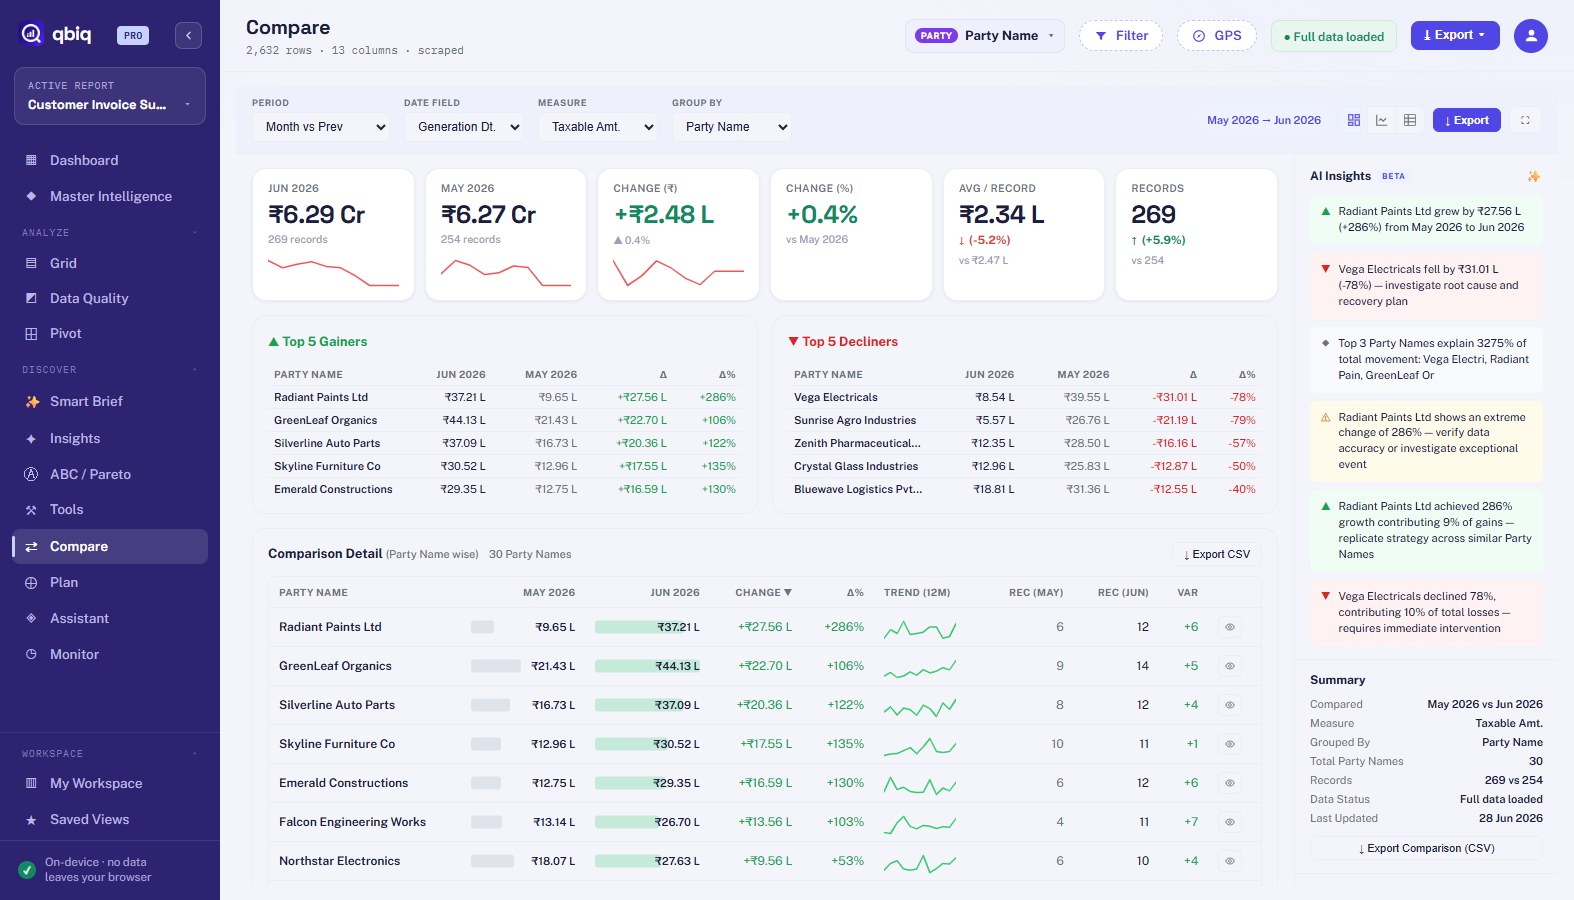
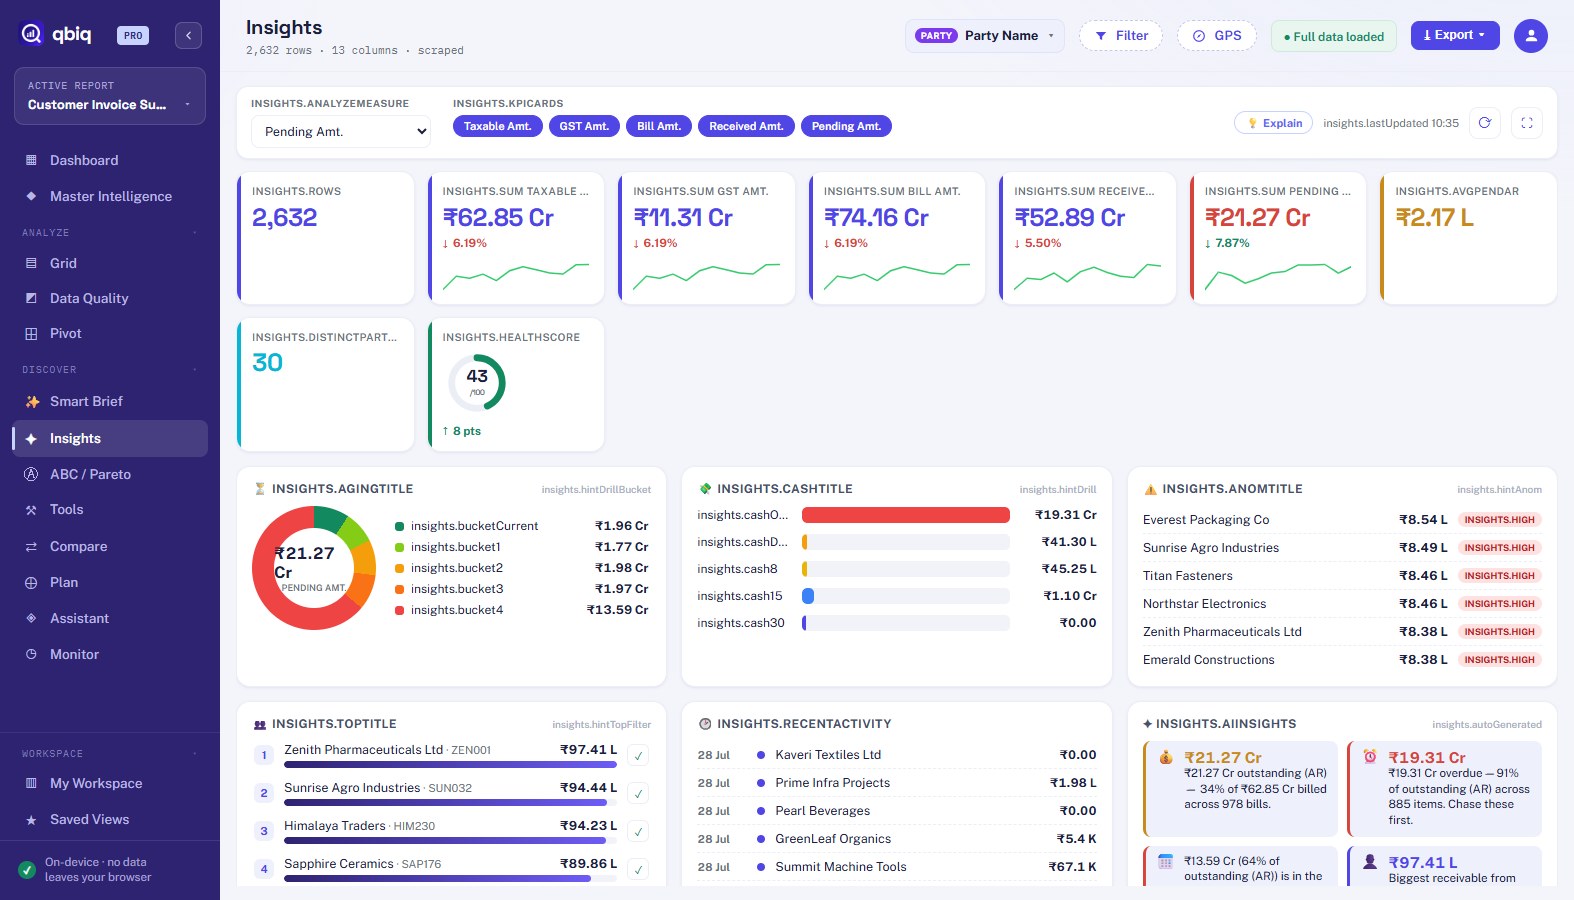
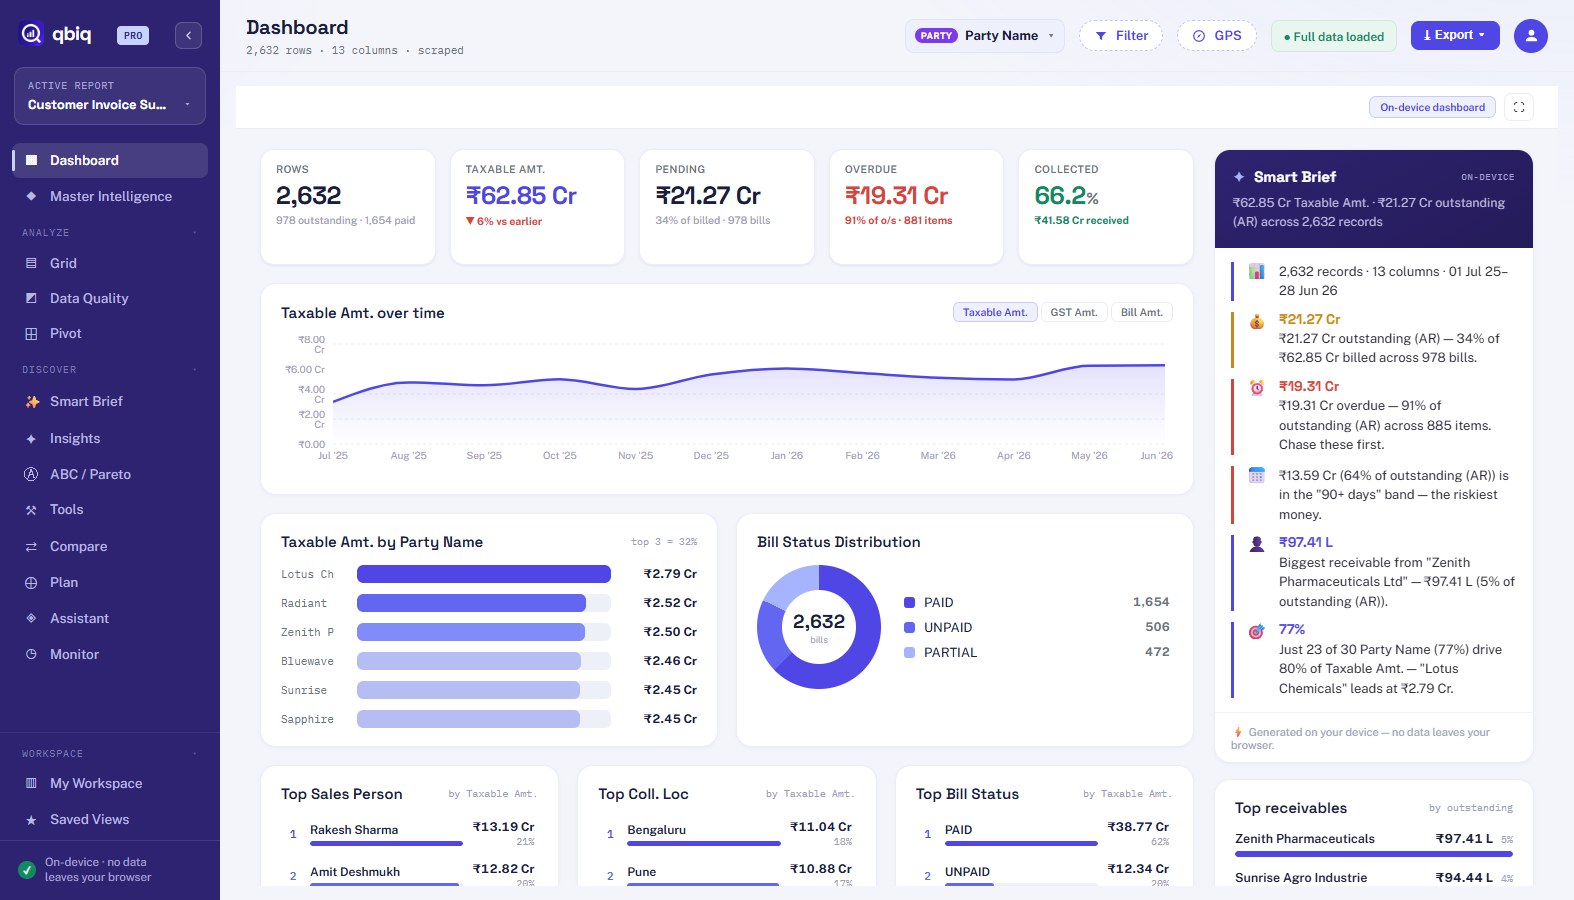
Open any report in your ERP, CRM or accounting system — qbiq turns it into a full analytics studio. Dashboards, pivots, AI insights, customer intelligence. Your reports stay in your browser.

No signup to try Reports stay on-device Works with CSV & Excel
your-erp.com › reports › invoices — analyzed by qbiq
qbiq Dashboard — instant on-device analytics of an ERP invoice report
Ready in 845 msAnalyzed in your browser
Works with anything that shows a table TallySAPZohoOracleSalesforceQuickBooksCSVExcel
One click

From raw report to boardroom answer.

The report you already have open becomes an executive briefing — no export, no upload, no waiting on anyone.

Your ERP report
A raw ERP report grid
click qbiq
The qbiq studio
qbiq Smart Brief — instant executive summary
Everything an analyst needs

The tools cloud BI charges thousands for.
In your browser tab.

Master Intelligence

360° profiles for every customer, vendor or branch — revenue, health score, churn risk, retention, ABC class — plus a portfolio summary of them all.

Smart Brief

An instant executive summary of any report: the headline number, the biggest mover, the risk to chase — written for you, on-device.

Pivot & Charts

Drag-and-drop pivot with virtualized rendering for 1M+ rows, chart types, subtotals and Excel export with native collapse groups.

Compare & Trends

Month vs month, YoY, custom windows — with waterfalls, per-entity movement, 12-month trends and AI-ranked drivers.

Insights & Alerts

Aging, cash-flow, anomalies, forecast, threshold alerts. Every number verified by a built-in validation engine.

🔗

Smart Blend

Join your master data (customer / item / vendor files) onto any report with fuzzy auto-matching — one click, remembered forever.

Master Intelligence

Every customer, understood.

Pick any master — customer, vendor, branch — and qbiq builds the portfolio: health, churn, retention, contribution, risk.

  • 360° profile per entity + portfolio summary
  • Churn & retention, ABC, health scores
  • 30/60/90-day windows & forecasts
qbiq Master Intelligence — portfolio summary
Smart Brief

The answer, before the analysis.

The headline number, the biggest mover, the money at risk — computed on your device the moment the report loads.

  • Executive summary in plain language
  • Aging, overdue & concentration callouts
  • Every insight drills to its exact rows
qbiq Smart Brief
Pivot & Grid

Pivot a million rows. In the tab.

Drag-and-drop pivots with virtualized rendering, subtotals, computed columns and native-collapse Excel export.

  • 1M+ rows, no server
  • Drag, drop, drill, chart
  • Excel export with outline groups
qbiq Pivot
Compare & Trends

See what changed, and who drove it.

Month vs month, quarter vs quarter, year over year — with waterfalls and AI-ranked drivers of the movement.

  • MoM · QoQ · YoY · custom windows
  • Waterfall of gainers & losers
  • Per-entity 12-month trends
qbiq Compare
Insights & Alerts

Aging, forecast, anomalies — verified.

A bento of receivables aging, cash-flow, anomaly detection and forecasts — each number checked by qbiq's validation engine.

  • Aging & collection risk
  • On-device anomaly detection & forecast
  • Threshold alerts on any measure
qbiq Insights
How it works

Three steps. No IT project.

1

Open your report

Any report inside your ERP, CRM, or accounting tool — or drop a CSV/Excel export.

2

Click qbiq

qbiq reads the table on screen (all pages, not just the visible one) and builds your studio instantly.

3

Analyze & share

Dashboards, pivots, drill-downs, AI answers. Export to Excel, PDF or an executive deck.

The qbiq difference

Your reports never leave your browser — by default, always.

Every other BI tool copies your business data to their cloud. qbiq's entire analytics engine — pivots, AI, forecasting — runs inside your browser tab.

  • Report rows are never uploaded to our servers
  • Analytics work fully offline once your report is loaded
  • AI insights computed on-device by default
  • Optional cloud AI (off by default) uses your own API key and receives only summary facts — never your raw rows
  • Only your email + license status are stored — nothing else
🔒
100% on-device
your rows stay local
Pricing

Start free. Upgrade when it pays for itself.

Install free from the Chrome Web Store — upgrade any time inside the app.

Free

$0
  • Core analytics & dashboard
  • Pivot, grid, smart brief
  • 1,000 rows per pull
  • CSV & Excel export
Add to Chrome

Pro

$9/mo
  • Everything, unlimited rows
  • Master Intelligence & 360°
  • Compare, Insights, Alerts, AI
  • Smart Blend + PDF export
Start with Pro

Team

$19/mo
  • All of Pro
  • Scheduled reports
  • Shareable links
  • API access
Choose Team

Enterprise

$49/mo
  • All of Team
  • White-label
  • Priority support
  • Custom ERP rules
Talk to us

🎁 Launch offer — coupon TOP100 gives the first 100 users 30 days of Pro, free.

FAQ

Questions, answered.

Does my business data really stay on my computer?

Yes. The full analytics engine (pivots, AI, forecasting, validation) runs inside your browser. Report contents are never sent to our servers — we only ever see your registration email and license status. If you choose to connect your own AI key (off by default), only aggregated summary facts are sent to your chosen AI provider, never your raw rows. Read the privacy policy.

Which systems does qbiq work with?

Any web-based ERP, CRM, or accounting system that shows reports as tables — plus CSV and Excel files. qbiq reads the report you have open, including paginated reports (it fetches all pages, not just the visible one).

Why does the extension ask for access to websites?

qbiq needs permission to read the report table on the page you invoke it on. It only activates when you click it, reads only the report data on that page, and never tracks your browsing.

How do licenses work?

Install free. Pro/Team unlock with a license key or in-app purchase. One license = one analyst, works across your devices. The TOP100 launch coupon gives 30 days of Pro free.

Can it handle big reports?

Yes — the grid and pivot are virtualized and tested with 1M+ rows, entirely in-browser.

What about refunds?

If qbiq isn't for you, email us within 14 days of purchase for a full refund — no questions asked.

Turn your next report into an answer.

⊕ Add to Chrome — Free